Crop monitoring resources
About crop monitoring
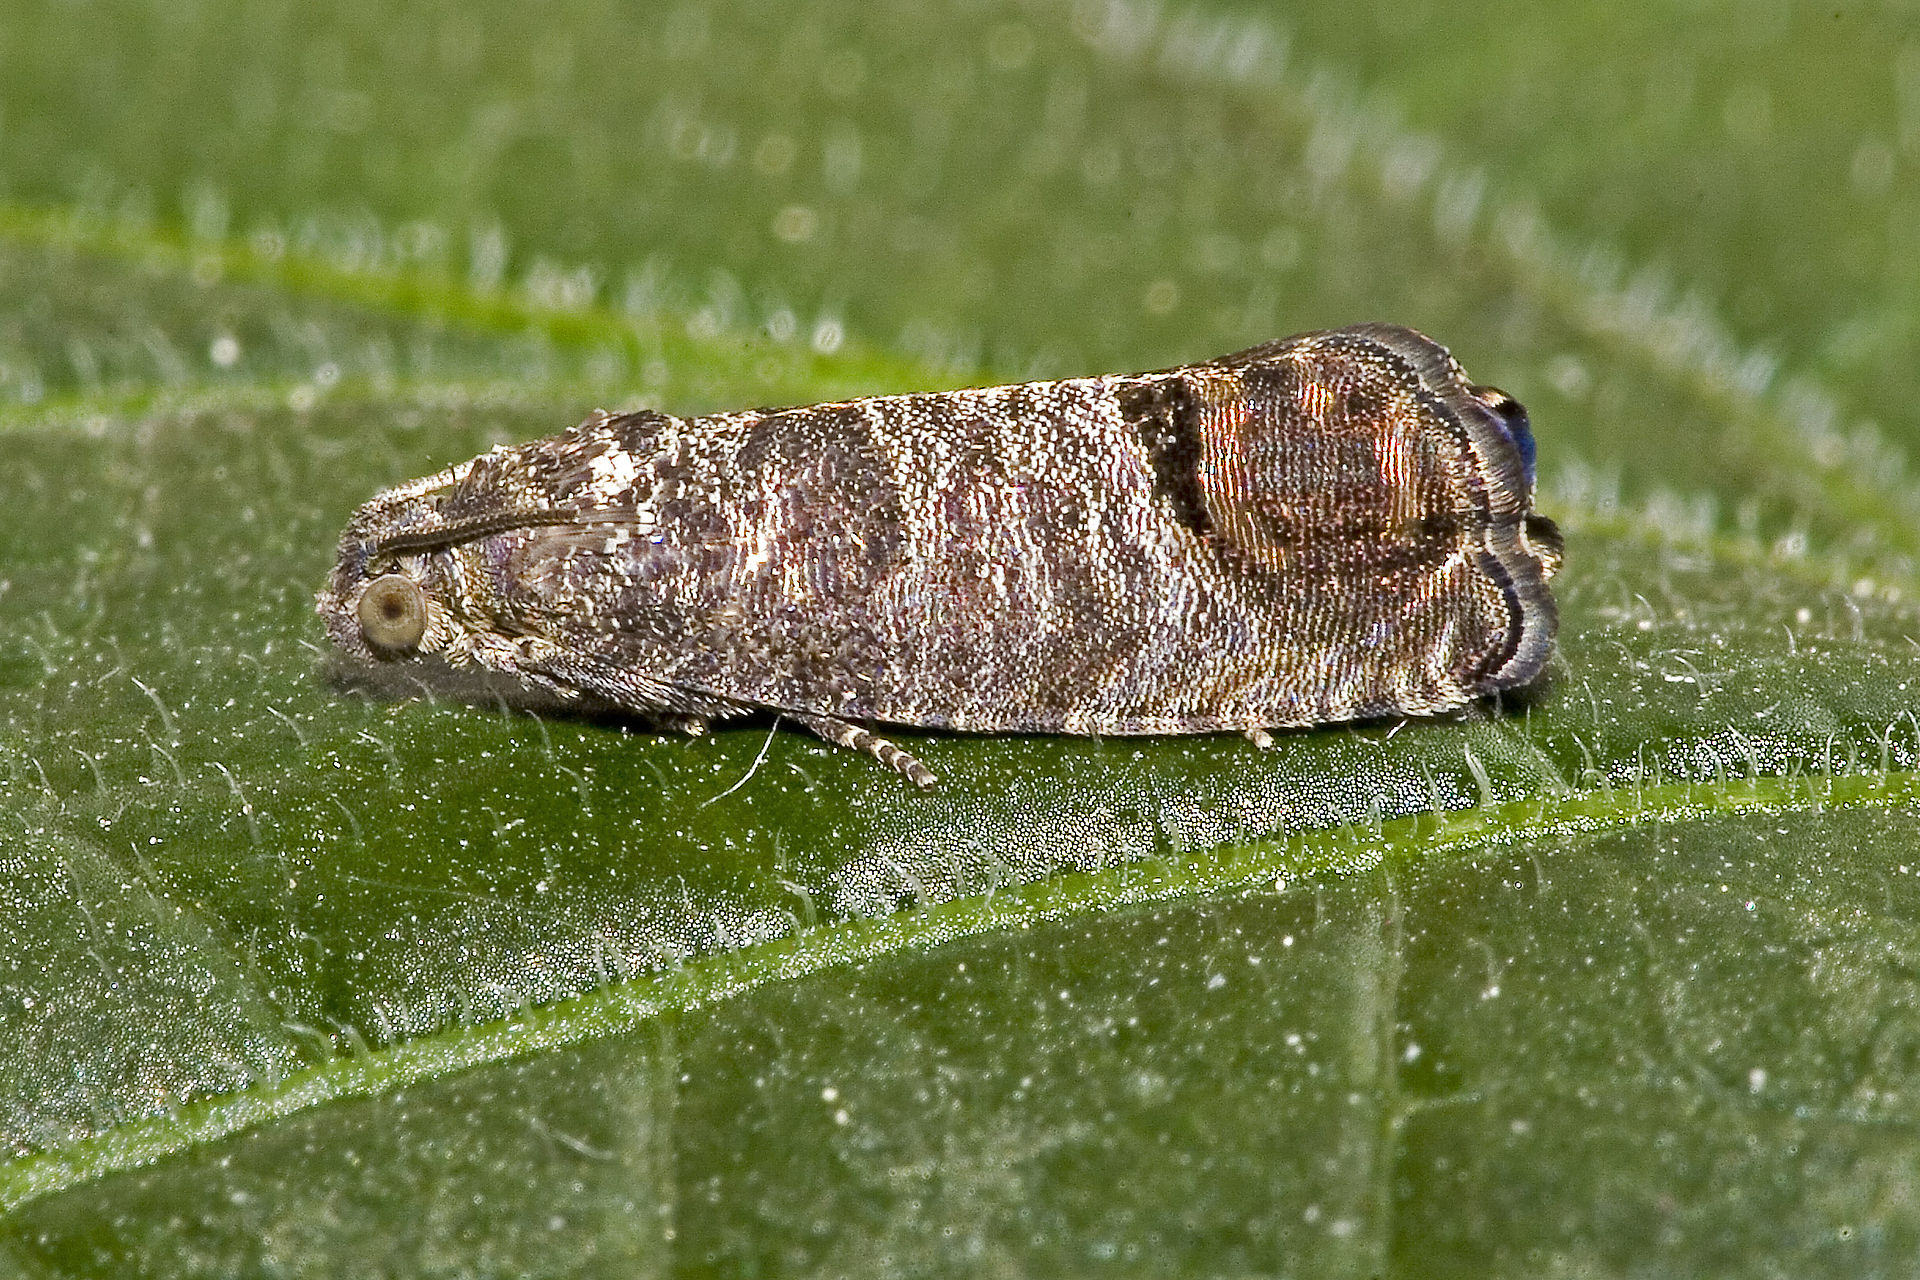
Crop monitoring is the regular inspection of crops for pests and diseases to quantify the level of pests and diseases within the production area or crop. Crop monitoring involves:
- making accurate identifications of pests and diseases and related crop injury present in the field;
- determining the relative size of pest populations;
- recording crop stage and management practices; and
- carefully recording all field observations.
Regular monitoring provides an early warning system about the presence and build up of pests and diseases and allows the timely implementation of control strategies before pest populations or diseases escalate. Regular monitoring also allows for the evaluation of pest management control actions, allowing pest management systems to be improved and refined over time.
Which pests and diseases to monitor for
Fruit growers should make sure they monitor and manage the pests and diseases which are economically important to the business.
In addition to these pests, there are a number of priority pests and diseases listed below which all fruit growers should ensure they monitor for on their property. These pests have been identified as priority pests because they impact on the willingness of interstate and/or international markets to accept fruit from Tasmania.
How to monitor for pests and diseases
Various monitoring techniques are used in the field. The technique selected will largely depend on the behaviour of the pest or diseases and the type of plant to be protected. Crop monitors must monitor according to an agreed sampling method when conducting a monitoring survey so that results are comparable between dates and sites.
Active monitoring
Active monitoring methods involve examining plant parts and the surrounding areas for the presence of pests and diseases. For diseases and stationary pests, this can include inspecting plant leaves, shoots and fruits for signs of pests or disease. For pests this will include the presence of pests, their density, and the level of damage caused. Make sure to examine all parts of the plant where each type of pest is most likely to be found. For pests which move between the canopy and the interrow, monitoring may also require surveying vegetation within the interrow. This can be performed with sweep nets or vacuum samplers, which allow pests in these spaces to be quickly captured and counted.
Sticky traps
Sticky traps can be an effective way to capture and count some pests, including flying pests. Trap placement is a critical factor in optimising trap performance and ensuring that you have sound information on which to base management decisions. Traps should be placed to coincide with pest activity. After hanging the trap, be sure that leaves and branches are cleared from around the trap entrances. Any interference with the pest’s ability to enter the trap will reduce capture rates.
Trapping can be made more effective for specific pests by use of a pheromone attractant. Many pheromones used in horticulture are based on ‘sex pheromones’ that are often attractive to the opposite sex. Lures based on the scents of ripe fruit may attract both sexes. Never place two different lures in the same trap, as contamination makes lures less effective and may, in some cases, make them completely ineffective. Wear disposable gloves when handling pheromone lures (or any other pheromone product) to avoid cross-contamination issues.
When trapping for different species, make sure to place traps at least 3m apart. It is recommended to write the species name (or abbreviation) on each trap, along with a trap identification number if there are multiple traps located within the production area. It is also a good practice to mark the location of each trap with flagging tape and record the location on a map.
How many sites to monitor
When planning your crop monitoring sites, having an accurate map which includes the size of each block will assist in determining the sampling pattern and number of monitoring sites.
Make sure you are monitoring enough locations throughout the production area to ensure you get a true representation and understanding of pest pressure. The numbers below indicate the minimum number of sites you should be monitoring.
<1Ha = 10 trees
1-3Ha = 15 trees
3-4Ha = 20 trees
4-6 ha = 25 trees
>6 ha = 30 trees
How frequently to monitor
Monitor the required number of trees in each block a minimum of fortnightly, keeping documented monitoring records.
There are times when weekly or even twice weekly monitoring ensures good agricultural practice. For example, monitoring for aphids or thrips is more likely to be effective if monitoring twice weekly from bud swell through to petal fall. Also, with light brown apple moth, weekly monitoring better captures the first flight.
What records to keep
Crop monitors should maintain a record of any trapping programs, including:
- The location and identity of each trap.
- The date the trap was deployed.
- Any required maintenance to the trap, including changes to pheromone lures.
- The results of each trap check, which should be dated & signed by the crop monitor.
Manual record keeping
Manual records of crop monitoring activities can be recorded on a crop monitoring record sheet. Each block should be recorded on a separate monitoring record sheet. Monitoring sheets must be also dated and signed on each monitoring day. Action required must be recorded on monitoring records, and action taken may be verified from spray records.
Digital record-keeping
There are a number of digital recordkeeping applications which can help growers bring together and analyse information from across multiple traps and production areas to better understand and manage pest and disease pressure. The GrowFruit App is a digital crop monitoring and pest forecasting tool available for download on iTunes or Google Play. This app was developed by Fruit Growers Victoria and is widely used by crop monitors working with apples, pears, cherries and summerfruit. The app allows growers to select their pests of concern, capture the results of trap inspections, and combine this information with local weather station information and biophysical models for different pests to forecast pest pressure.
Resources for crop monitors
Recording sheets
- Apple Export Crop Monitoring Record (members only)
- Pest Monitoring Record China Apples (members only)
- Monitoring summary for China essentials (members only)